SalesVision Dashboard
An interactive sales & revenue dashboard for an FMCG distributor — turning raw transaction data into real-time business intelligence with automated monthly reports.
50%
Faster decisions
12+
KPI metrics tracked
2mgg
Delivery time
The Challenge
An FMCG distributor with hundreds of daily transactions was still relying on manual Excel reports to track sales performance. Reports took days to compile, were often outdated by the time they reached management, and provided no way to drill down into specific products, regions, or time periods.
Our Solution
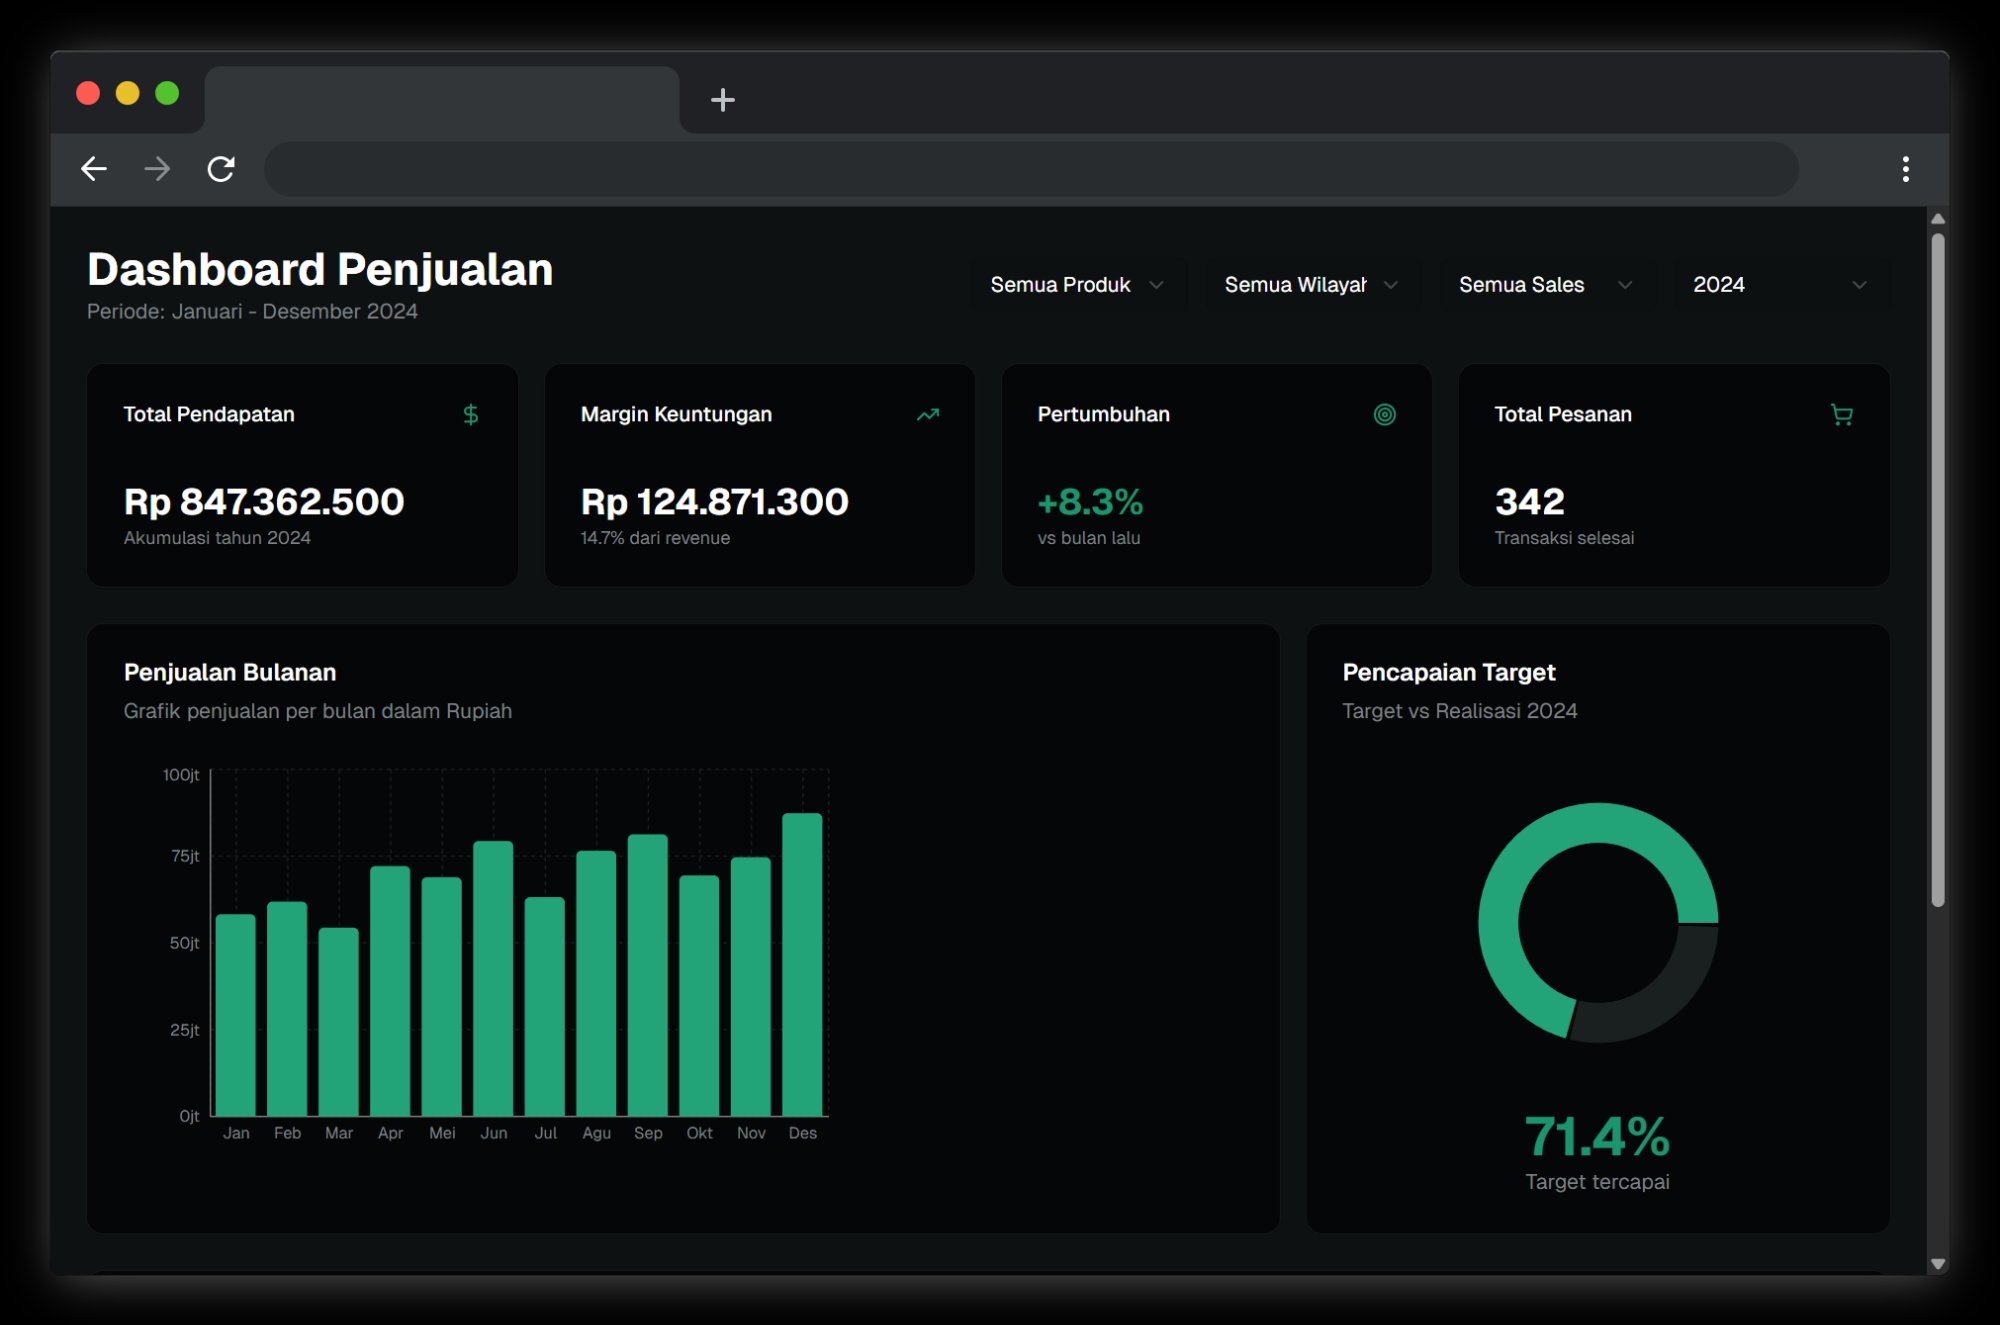
We built an interactive dashboard connected to their transaction database, visualizing sales data in real time. Management can now filter by product, region, salesperson, and date range — and receive automated PDF reports every month.
- Real-time sales & revenue visualization
- 12+ KPI cards (revenue, margin, growth, top products)
- Filter by product, region, salesperson, date range
- Trend charts with month-over-month comparison
- Automated monthly PDF report via email
- Mobile-responsive for on-the-go access
Tech Stack
The Result
Management can now make data-driven decisions in minutes instead of days. The dashboard reduced report preparation time by 50% and surfaced insights that led to a 15% improvement in top-selling product allocation.
Got a project in mind?
Drop us a message and we'll get back to you within 24 hours.
Tell Us About It